Running a behavioral health treatment center is no small task. You’re constantly making important decisions about staffing, programming, clinical protocols, and growth. But many of those decisions are made with incomplete information, simply because most treatment centers do not have a clear, consistent picture of what their numbers are actually saying.
That is not a criticism. Behavioral health billing is complex, the revenue cycle has many moving parts, and when your day-to-day demands pull you in every direction, financial analytics often fall to the bottom of the priority list. Still, one of the biggest differences between treatment centers that scale sustainably and those that struggle is knowing which KPIs deserve your attention and understanding what those numbers are telling you.
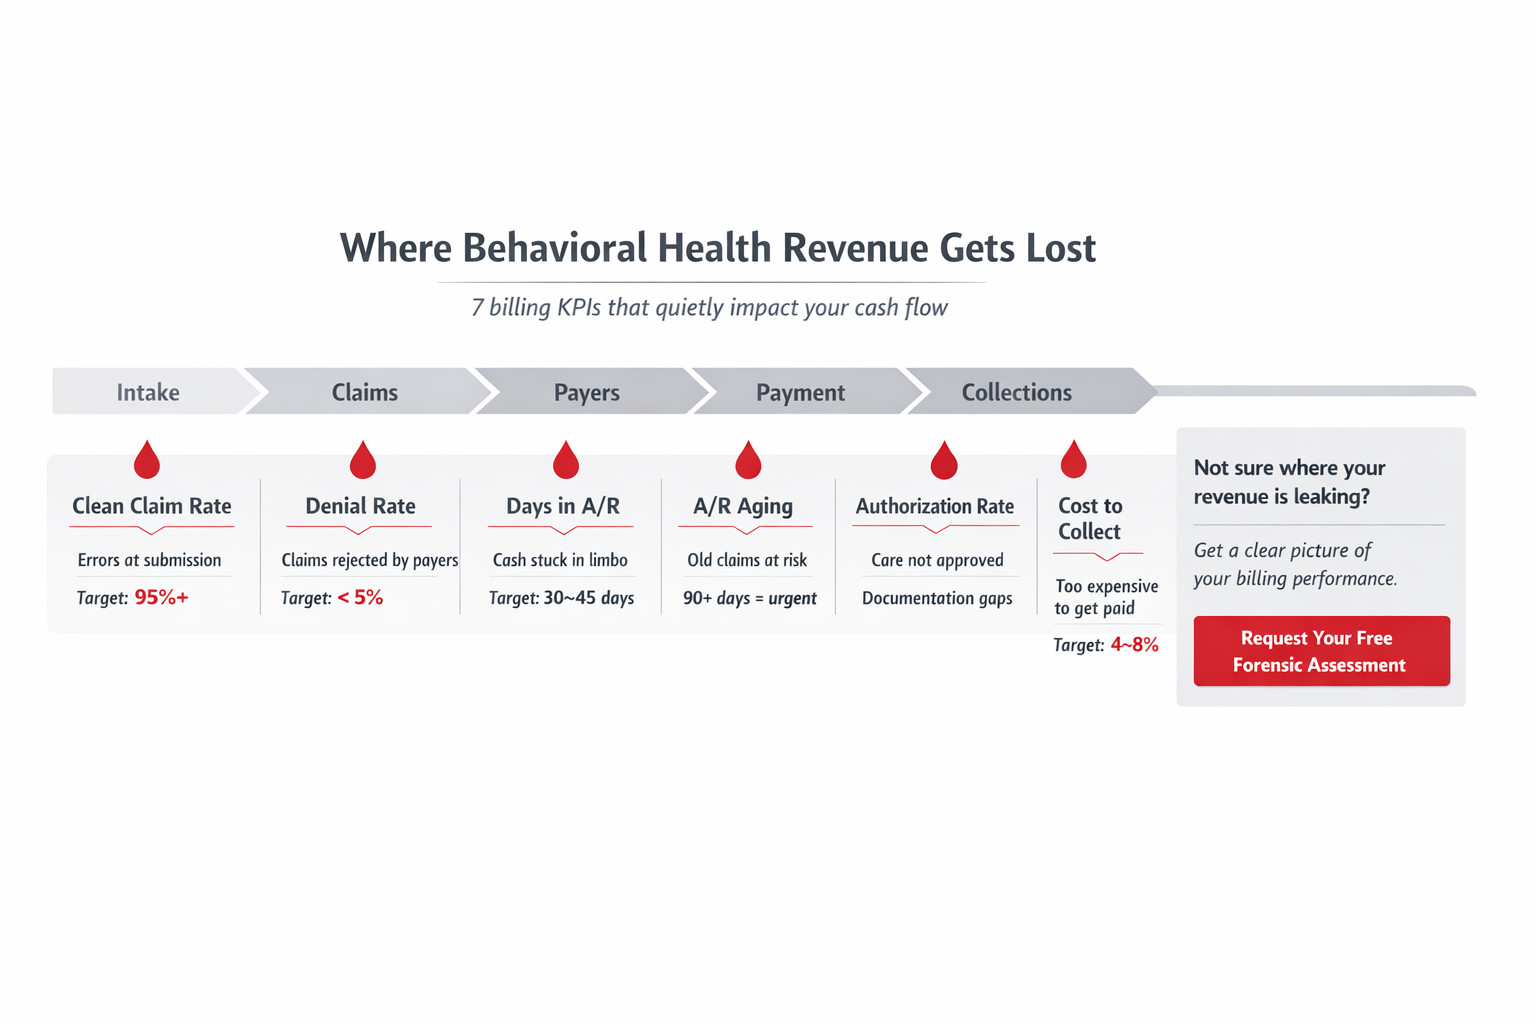
Here are seven key performance indicators that matter most in behavioral health revenue cycle management, what each one reveals, and what healthy benchmarks typically look like.
1. Clean Claim Rate
Your clean claim rate is the percentage of claims that pass through the billing process without errors, rejections, or corrections on the first submission. It’s one of the clearest indicators of how well your billing and coding operation is functioning upstream.
A high clean claim rate means your intake process, credentialing, documentation, and coding are all working together effectively. A low clean claim rate means somewhere in that chain, errors are being introduced that require rework before claims can be paid.
So what should you be aiming for? Industry benchmarks generally place a strong clean claim rate at 95% or above. If you’re consistently below 90%, you should be investigating why this is happening. Errors not only slow down your cash flow but also add administrative cost to every claim that needs to be corrected and resubmitted.
2. Denial Rate
Your denial rate is the percentage of submitted claims that payers reject without payment. In behavioral health billing, denial rates tend to run higher than in many other specialties for two main reasons. The first is the level of documentation scrutiny payers apply to mental health and substance use services. The second is the complexity of authorization and utilization review requirements. That’s why strong denial management is such an important piece of the puzzle.
But high denial rates are not inevitable. They are almost always traceable to specific, fixable root causes, such as credentialing lapses, missing authorizations, documentation gaps, coding errors, or eligibility issues. Effective denial management helps behavioral health organizations identify these patterns, respond quickly, and prevent the same issues from recurring. Tracking your denial rate by payer and by denial reason gives you clearer insight into where problems are happening and what needs to improve.
What numbers should you be aiming for? A well-managed behavioral health billing operation typically targets a denial rate below 5%. Anything above 10% on a consistent basis is a sign that something systematic needs to change.
3. Days in Accounts Receivable (A/R)
Days in A/R measures how long it takes, on average, from the date of service to the date of payment. It’s one of the most direct measures of your cash flow health. Long A/R days mean money is sitting in limbo, which creates the kind of cash flow strain that affects payroll, operations, and your ability to reinvest in the organization.
In behavioral health, days in A/R can creep up for a number of reasons: slow claims submission, unworked denials aging out, authorization delays, or a backlog of patient balance statements that aren’t being followed up on.
A healthy days in A/R benchmark for behavioral health is generally 30 to 45 days. Anything above 60 days warrants a close look at where the delays are occurring.
Not Sure Where Your Numbers Stand?
Integrity Billing’s forensic assessment examines your key performance indicators across the full revenue cycle. We’ll tell you exactly what’s working and what isn’t. Request your free forensic assessment today to get a clear picture of where your revenue cycle stands.
4. A/R Aging by Payer
Days in A/R gives you an average, but A/R aging by payer tells you the story behind that average. This KPI breaks down your outstanding receivables by how long they’ve been outstanding and by which payer owes you, giving you a much more actionable view of where to focus collection efforts.
In behavioral health, certain payers are consistently slower than others. For instance, Medicaid managed care plans, behavioral health carve-out payers, and plans with complex authorization requirements often have longer adjudication timelines. Knowing this helps your billing team prioritize follow-up activity and flag claims that are taking exceptionally long.
Here are the timelines: Claims aged 90+ days should be actively worked or escalated. Claims aged 120+ days represent revenue at serious risk. Not only does timely filing matter but also the older a claim gets, the harder it typically is to collect.
5. Authorization Approval Rate and Utilization Review Outcomes
This is a KPI that’s specific to behavioral health and one that many organizations don’t track as closely as they should. Your authorization approval rate measures what percentage of authorization requests are approved by payers on the first submission. Your utilization review outcomes track whether concurrent reviews for ongoing treatment are being approved, partially approved, or denied.
Low authorization approval rates and frequent utilization review denials are often signals of a documentation problem. Oftentimes, the clinical notes aren’t clearly establishing medical necessity at the level of care being requested. They can also indicate that your team isn’t submitting authorization requests with the right supporting information or isn’t engaging effectively with payer reviewers.
Tracking this KPI by payer and by level of care (PHP vs. IOP vs. outpatient) helps identify patterns, such as which payers are challenging, which clinical teams need documentation support, and where appeals are being won or lost.
6. Net Collection Rate
Your net collection rate is arguably the most important financial KPI on this list. It measures the percentage of collectible revenue that your organization is actually collecting, after contractual adjustments, but before write-offs for bad debt or timely filing.
The distinction between gross and net collection rate matters here. Your gross collection rate counts all charges. Your net collection rate counts what you were actually entitled to collect under your payer contracts. This number ultimately tells you whether your billing operation is doing its job.
A strong net collection rate in behavioral health is 95% or above. If your net collection rate is below 90%, revenue is leaving the organization that shouldn’t be. The gap between what you’re entitled to collect and what you’re actually collecting is real money, and it can often be recovered with the right billing processes in place.
7. Cost to Collect
Cost to collect measures how much your organization spends in staff time, technology, and overhead for every dollar of revenue collected. It’s a measure of billing efficiency, and it’s one that often gets overlooked in favor of the more visible revenue numbers.
A billing operation with a high clean claim rate, low denial rate, and strong net collection rate but a very high cost to collect may still be underperforming financially. This is often surprising to learn, but the reality is that they’re spending too much to get paid. These organizations could be over-staffed in billing, relying on manual processes that could be automated, or spending excessive time reworking claims.
Industry benchmarks for cost to collect in behavioral health typically range from 4% to 8% of net revenue collected. Operations on the lower end of that range are generally well-automated and running clean claims consistently. Higher cost to collect often points to inefficiency in the claims process.
Knowing Your Numbers Is the First Step. Acting on Them Is the Next.
KPIs are only useful if you’re looking at them regularly and using them to drive decisions. A clean claim rate that’s been sitting at 88% for six months isn’t just a number but a sign that something in your billing and coding process needs attention. A net collection rate trending downward is a warning that revenue is eroding somewhere in the cycle.
Most behavioral health treatment centers we work with don’t have this visibility when they come to us. They know things aren’t quite right, but they don’t have the data to pinpoint why. Getting that clarity is exactly what we do.
Contact Integrity Billing today at 888-368-7461 or fill out our online contact form to talk through your revenue cycle performance. Whether you’re looking for a full billing partnership or just want a clearer picture of where you stand, we’re here to help and get you on a better path.