
Every behavioral health practice generates data. Patient visits, claims submitted, payments posted, authorizations requested, denials received — the numbers are always there. But data without context is just noise, and the difference between a practice that is thriving and one that is struggling often comes down to whether leadership is tracking the right metrics, understanding what they mean, and acting on what they reveal.
Key performance indicators (KPIs) are the specific measurements that cut through the noise and tell you how your practice is doing. In behavioral health billing, where the administrative complexity is high and the margin for error is low, knowing which KPIs to watch and what to do when they move in the wrong direction is one of the most valuable operational skills a practice can develop.
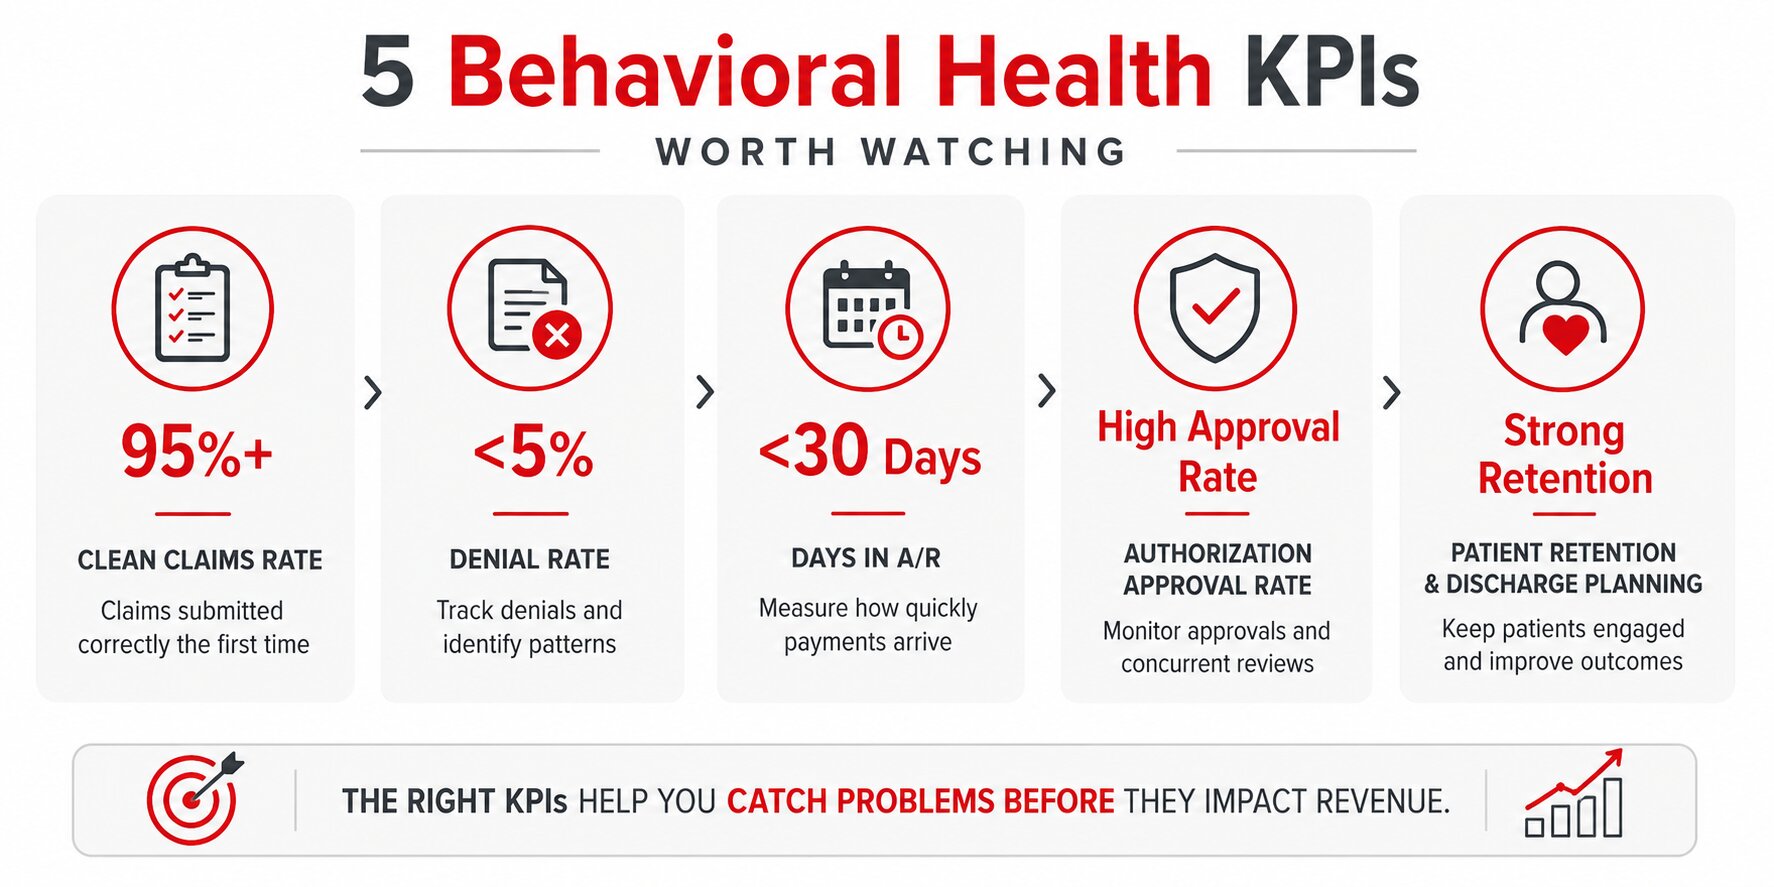
Here are the behavioral health metrics you should be looking at because they’re the ones that actually matter.
Clean Claims Rate
The clean claims rate is the percentage of claims that are submitted correctly the first time and processed without requiring follow-up, correction, or resubmission. In behavioral health billing, this number is a direct reflection of the accuracy and thoroughness of your billing and coding processes. Industry benchmarks generally target a clean claims rate of 95% or higher. Practices that fall below that threshold are likely leaving money on the table through delayed reimbursements and avoidable rework.
It’s important to note that a low clean claims rate is rarely a random problem. It typically points to something specific: documentation gaps, coding errors, credentialing issues, or a mismatch between the services delivered and the way those services are being represented on the claim. Identifying the root cause quickly is the difference between a temporary dip and a chronic revenue drain.
Denial Rate and Denial Reason Breakdown
Claim denials are one of the biggest sources of lost revenue in behavioral health. But tracking the number of denials is only part of the picture. Strong denial management requires providers to understand why denials are happening, what patterns are emerging, and what those patterns reveal about the process behind them.
A denial rate above 5% is often a sign that something needs attention, but the denial reasons are where the real insight lives. Common patterns may include:
- Medical necessity denials: These may point to documentation issues, weak clinical justification, or gaps in utilization review.
- Authorization-related denials: These often suggest breakdowns in prior authorization tracking, missed reauthorizations, or mismatches between approved services and billed services.
- Coding denials: These may indicate problems with diagnosis codes, CPT codes, modifiers, or the way services are being translated from documentation into claims.
- Eligibility or benefits denials: These can signal issues at intake, insurance verification, or benefit confirmation before services begin.
- Timely filing denials: These may reveal workflow delays, staffing gaps, or claims that are sitting too long before submission.
Each denial reason tells a different story and requires a different response. That’s why detailed denial tracking is far more useful than watching the overall number alone.
Days in Accounts Receivable
Days in accounts receivable measures how long it takes, on average, for a submitted claim to result in a collected payment. For behavioral health practices, a healthy target is generally under 30 days, though many practices run significantly higher without realizing the cash flow impact.
When days in AR creeps up, it can signal problems at multiple points in the revenue cycle: slow claim submission, authorization delays, payer processing issues, or insufficient follow-up on outstanding claims. Watching this number weekly gives practice leadership early warning when the revenue cycle is starting to back up, before the impact shows up in the bank account.
Authorization Approval Rate and Concurrent Review Outcomes
In behavioral health, many services require prior authorization and ongoing concurrent review by payers, which makes the authorization approval rate an important KPI to watch. A healthy approval rate can be a good sign that medical necessity is being documented clearly, utilization review processes are working well, and clinical teams understand what payers need in order to approve continued care.
Tracking concurrent review outcomes — including how often continued stay authorizations are approved, denied, or reduced — gives practices a clearer picture of how their clinical documentation is being received by payers. When approval rates start to decline, it may be an early sign that documentation needs closer attention. If not addressed, those issues can eventually contribute to more denials, delayed payments, and reduced reimbursement.
Patient Retention and Discharge Planning Completion
Not all important KPIs are financial. Patient retention, or the percentage of patients who remain engaged in treatment long enough to achieve clinical progress, is both a quality metric and an operational one. High dropout rates affect outcomes data, referral relationships, and ultimately revenue. Understanding where in the treatment episode patients are disengaging, and why, gives leadership the information they need to make targeted improvements.
Discharge planning completion rate is a related metric that often goes unmeasured. When patients leave treatment with a documented, complete discharge plan, they are statistically more likely to maintain their progress. It’s also the kind of quality indicator that payers and accrediting bodies look for.
Turning Numbers Into a Stronger Practice
Behavioral health metrics are only useful when they lead to better decisions. Denial rates, authorization approval rates, aging AR, clean claim rates, and reimbursement trends all tell a story about where your revenue cycle is working and where money may be getting delayed, denied, or lost.
At Integrity Billing, we help behavioral health providers look beyond the surface numbers to understand what’s really happening inside their billing process. If your metrics are raising questions or you’re not sure which numbers you should be watching, start with a free forensic billing assessment. Our team will review your revenue cycle, identify potential problem areas, and help you see where stronger billing, documentation, authorization, or follow-up processes could improve financial performance.
Contact Integrity Billing today to request your free forensic billing assessment and get a clearer picture of what your revenue cycle may be missing.